Adapted for the 2014-15 milestone 20th Year Anniversary edition of the McKeen’s Hockey Pool Yearbook, readers discerned debuts of modern metrics prevalent through analytics work by a burgeoning group of online hobbyists and statistical bloggers. NHL teams have noticed, snapping up talent for proprietary work.
That’s the cue to incorporate analytics methodology to the 2015-16 edition to augment our customary robust scouting notes. Rate stats are an important element of analysis, requiring a slight mental shift for poolies that evaluate players on a per game/day basis. Numerical consistency offered by rate stats normalizes production and effectively eliminates game-to-game randomness over larger sample sizes. Per 60 minutes has become the standard and we have adhered to that within these profiles.
Points-per-60 (Pts/60) – or goals-per-60 (G/60) are powerful, albeit deceptive in instances without further context, and pliable for use across broad spectrum, each providing context, while developing baselines and benchmarks. Broader scope of these concepts are available online.
Introducing Line Baselines/Benchmarks
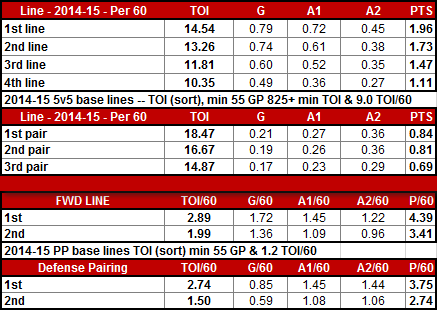
Using 2014-15 5v5 and 5v4 player data collected from Hockey Analysis each data set was pared for players with minimum 55 games and 825 or more 5v5 minutes, playing 9 minutes time on ice per game or more - eliminate replacement level players and call ups due to injury. The data set was subsequently sorted by time on ice.
Sorting by Points-per-60 was an option however the randomness of point production doesn’t trump playing time as the most important metric.
No ice time, no production.
Players were placed into bins of 90 (30 teams times 3 players per line) with the cutoff as time on ice on the 91st, 181st, 271st and 361st. Defensemen bins were for 60 players (30 teams, times 2 players per a pairing).
Each level’s cutoff is the benchmark for a line’s baseline production – e.g. 1.96 Pts/60 is a 1st line cutoff, 1.73 the 2nd line cutoff etc. The table below highlights time on ice, goals, first assists (A1) and secondary assists (A2) and points, all normalized on a per-60 minute basis.
Forwards registering less than 1.11 Pts/60 (0.69 for defensemen) should be considered replacement level and unlikely desirable for leagues without a minor league system.
Power Play (5v4)
Same methodology applies to 5v4 adapting for two power play units, (90 forwards and 60 defensemen for first unit and 91-180 (defensemen 61-120) for second unit – minimum 55 games and 1.2 minutes of 5v4 time per 60 minutes.
Shot Attempts
Shot attempt rates per 60 could be calculated as well. Baseline weightings of player’s individual contributions to shots, unblocked shots (iFen)** and total shot attempts (iCorsi)**. Poolies with shot on goal categories should find value here.
** iFen and iCorsi measures direct on-ice involvement in shot attempts and easily adaptable to goals, assists and points earned on goals while on the ice. This is a powerful indicator of how productively players are using their ice time. Also referred to as Individual Goals/Assists/Point Percentage, readers will find these references in the profiles – see David Pastrnak for a direct example – based on the baseline tables below for forwards and defensemen.
Individual Point Percentages

 One takeaway from the individual point percentage tables for forwards is the 2nd/3rd line individual point percentage (IPP) are almost interchangeable; coaches make this distinction too, often moving players in this range up and down the lineup depending on situation. Defensemen ranges are fairly tight with the distinction of ice time separating pairings at even strength.
Corsi - Shot Attempts
Drilling down deeper into total shot attempt composition, observe the more arbitrary CA60 (total on-ice shot attempts against), contrasted with the CF60 (total on-ice shot attempts for) with a spanning range and mid-line gap separating top and lower roster players.
CF% is expressed as a ratio, CF/(CF60 + CA60) and we can establish shot attempt benchmarks. Once individual CF% is known comparisons can be made to each player’s CF% relative to the overall team’s while the player is not on the ice, expressed in the far right column CF% RelTM.
Minutes Between Shot Attempt Events
Measuring the time duration between individual shot attempt events provides more insight. Players involved in higher event hockey are more likely to earn points in a more consistent fashion. Ranging between 4:56 and 5:31, top two line forwards make individual shot attempts 30 seconds quicker than lower roster players, an indication of how much more often they carry the play.
***********
Readers will notice scattered references inour profiles to various production equivalencies of a 1st, 2nd liner, a 2nd unit PP forward, or 3rd pairing defenseman. the values are all presented here to give you the ranges.
Happy drafting, and have a fantastic season!
If you wish to subscribe to mckeenshockey.com please click HERE.
Team McKeen's


