Welcome to the playoffs!
This preview is fairly simple to navigate through, but there are some elements that require some explanation.
Stats and graphics were compiled and prepared by Gus Katsaros and the writeups were written by Carl Lemelin
Each image can be blown up to a larger size by clicking on the graphic. The first click will take you to a splash page, and then clicking on the same image on that page will blow it up to its original size.
Every series preview has the same format.
All data was compiled using timeonice.com and NHL.com
The images are as follows:
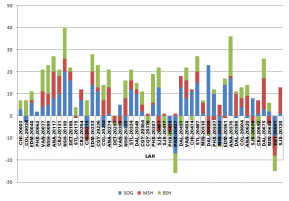
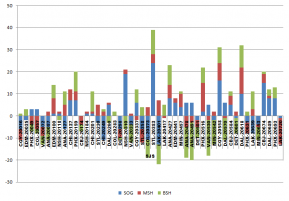
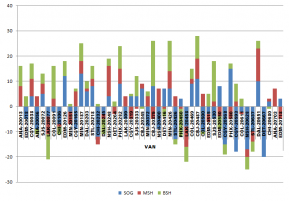
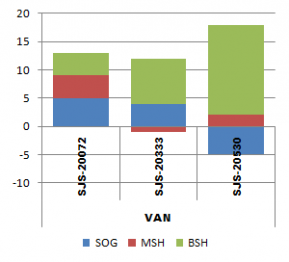
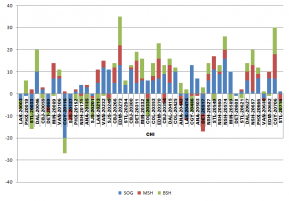
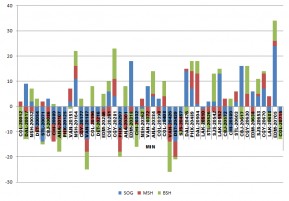
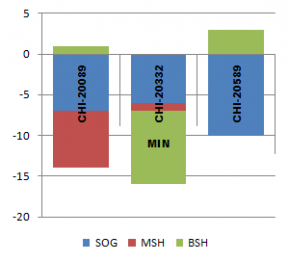
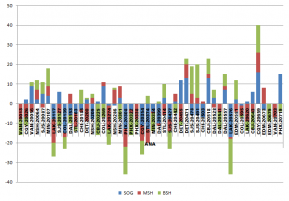
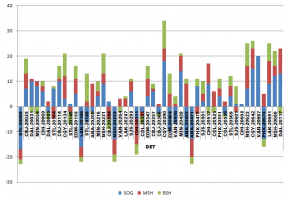
A game-by-game Corsi breakdown by components, with the colors defined by the legend at the bottom.
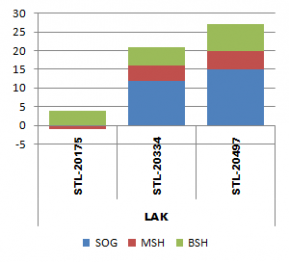
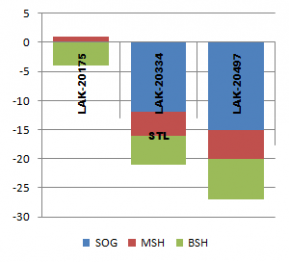
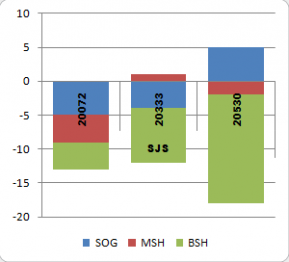
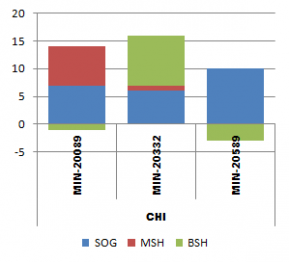
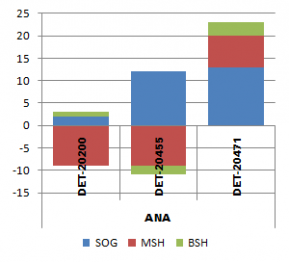
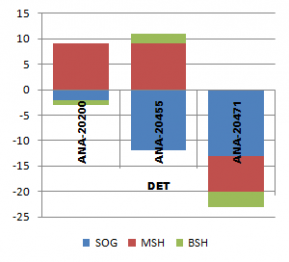
Underneath is the head-to-head matchup broken down by their basic Corsi makeups.
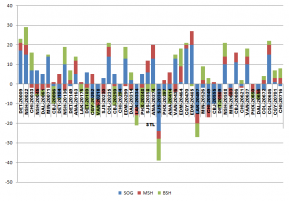
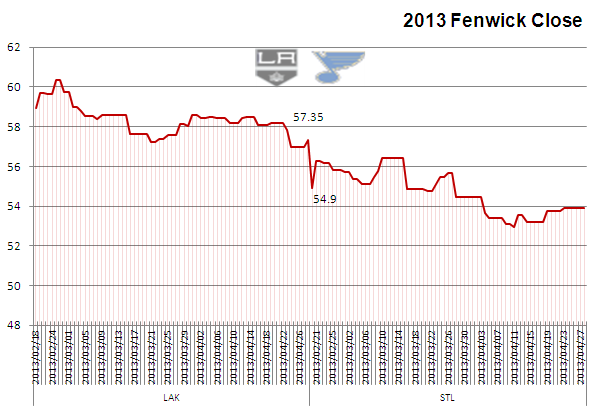
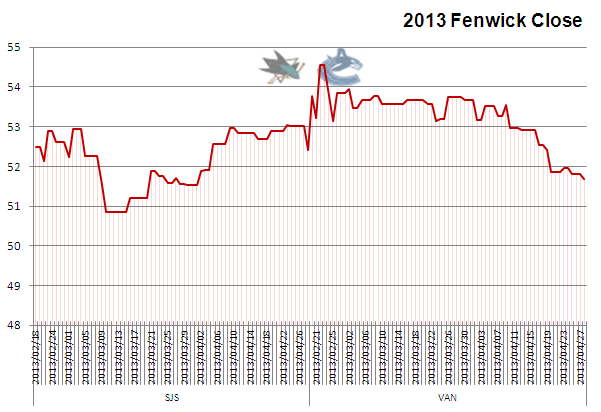
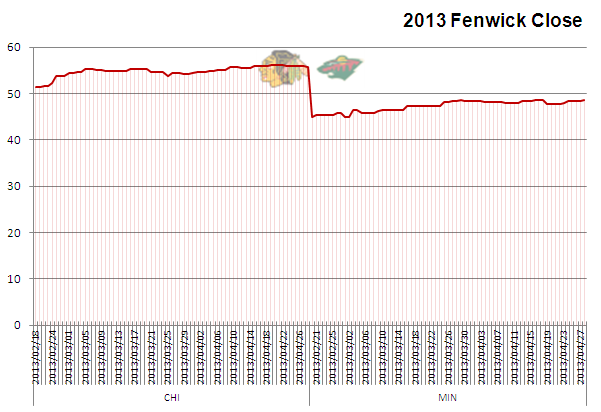
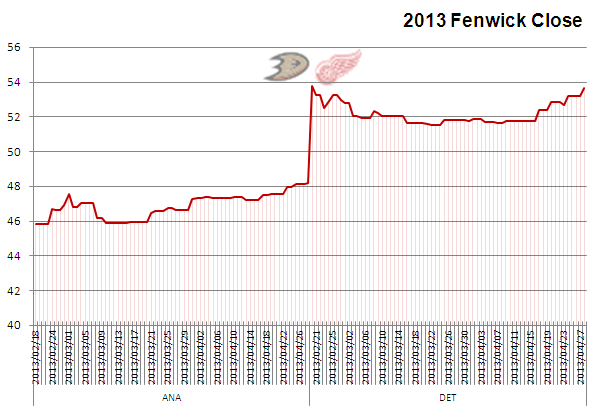
The main image is a side by side comparison of the team's season plotted using the Fenwick Close. (Note; Archiving for FenClose began Feb 18 which will produce and N/A for games prior to that date.
Underneath all the visuals is a table with the head-to-head matchups. Most of the headings are self-explanatory, but the structure has the team that placed higher in the standings as the 'team', with the Decision, home/road and other columns based on that team versus their opponent.
Clicking on the team in the column will open a new window with the gamesheet for that game (hover over the team for a title).
TS is 'times shorthanded'.
The FenClo columns are the Fenwick Close for each of the sides, as they entered the game against their opponents.
Colored rows are as follows:
A BLACK row indicates the 'Team' column played the previous night as part of a back-to-back set, while the 'OPP' was rested.
A BLUE row indicates both teams played the previous night as part of a back-to-back set.
Enjoy the preview and if you're team is in the playoffs, enjoy round 1.
**********************
Via Carl Lemelin
Most of the playoff previews you’ll read will post series opponents’ records during the season series. This has proven to be a very bad indicator of the eventual outcome in recent years; too many outside factors can influence the results, regular season series being spread out over 6 months (4 this year). But there is one thing the past 6 Stanley Cup finalists have in common: they’ve all finished the regular season on a high note.
All but one of these teams were at least 3 games over .500 during their final 10 regular season games. The 2010 Philadelphia Flyers (4-5-1) were the exception, but even they finished well going 3-1 in their final 4 games. The collective .642 points percentage of the group in the final stretch is enough to convince me that strong finishing squads have much better odds of making a significant run in the post-season.
In this year’s Wild West, Chicago St-Louis and Detroit fall into this category of momentum builders. Here are the Western Conference first round match-ups as we see them (Last-10 records in parentheses).
**********************
| Date | Team | Dec | OS | HR | Opp | GF | GA | PPG | PPOpp | PPGA | TS | SF | SA | FenClo LAK | FenClo StL |
| 2/11/2013 | STL | L | H | LAK | 1 | 4 | 1 | 5 | 1 | 5 | 22 | 23 | #N/A | #N/A | |
| 3/5/2013 | STL | L | R | LAK | 4 | 6 | 0 | 3 | 0 | 6 | 14 | 29 | 55.11 | 58.55 | |
| 3/28/2013 | STL | L | H | LAK | 2 | 4 | 1 | 3 | 0 | 4 | 22 | 40 | 54.46 | 58.14 |
4-ST-LOUIS (7-3-0) vs 5-LOS-ANGELES (5-3-2)
This may be a homer series. Both teams are very comfortable on their own ice. The difference may be that the Blues are almost as confident on the road (14-9-1), but not the Kings (8-12-4). The Kings did sweep the Blues in last spring’s second round, but Ken Hitchcock is a master at making adjustments. Jonathan Quick and Drew Doughty, key playoff contributors for the champs, have been shadows of themselves in this short season. St-Louis may have the deepest overall roster in the league and they’re playing hungry; they look like last year’s Kings. Carl says: Blues in 5.
**********
| Date | Team | Dec | OS | HR | Opp | GF | GA | PPG | PPOpp | PPGA | TS | SF | SA | FenClo Van | FenClo SJS |
| 1/27/2013 | VAN | L | R | SJS | 1 | 4 | 0 | 7 | 2 | 8 | 24 | 27 | #N/A | #N/A | |
| 3/5/2013 | VAN | O | SO | H | SJS | 2 | 2 | 0 | 5 | 0 | 3 | 38 | 30 | 53.68 | 52.27 |
| 4/1/2013 | VAN | L | R | SJS | 2 | 3 | 0 | 0 | 1 | 3 | 25 | 35 | 53.67 | 51.54 |
3-VANCOUVER (5-4-1) vs 6-SAN JOSE (5-5-0)
Attention to details will determine the winner of this series. Of these two evenly matched teams, the Sharks have an edge in scoring depth. Derek Roy and Ryan Kesler must help spread the Canucks’offense, preventing San Jose from concentrating all their checking efforts on the Sedin twins. Kevin Bieksa must also find his 2011-12 form, help move the puck north efficiently and put shots on net from the point on the PP, a unit that has struggled all season. We believe these ‘ifs’ will materialize and like Vancouver’s depth on defense; Corey Schneider over Antti Niemi. Carl says: Canucks in 6.
*******************
| Date | Team | Dec | OS | HR | Opp | GF | GA | PPG | PPOpp | PPGA | TS | SF | SA | FenClo CHI | FenClo MIN |
| 1/30/2013 | CHI | O | SO | R | MIN | 2 | 2 | 0 | 2 | 0 | 4 | 32 | 25 | #N/A | #N/A |
| 3/5/2013 | CHI | W | H | MIN | 5 | 3 | 0 | 3 | 1 | 2 | 32 | 23 | 55.31 | 45.9 | |
| 4/9/2013 | CHI | W | R | MIN | 1 | 0 | 0 | 2 | 0 | 1 | 31 | 20 | 55.7 | 47.88 |
1-CHICAGO (7-2-1) vs 8-MINNESOTA (4-5-1)
The Wild backed into the playoffs and were plagued by inconsistent play throughout the season. By contrast, the Hawks have had one of the most dominant regular seasons in NHL history. The major indicators all point toward the Windy City: 5-on-5 play (CHI-1st, MIN-24th), PK% (CHI-3rd, MIN-18th) and SV% (Crawford-.926, Backstrom-.909). Minny simply doesn’t have an answer for Chicago’s overall depth, especially on defense once you get past Ryan Suter. The three-headed monster of Patrick Kane-Jonathan Toews-Marian Hossa dominates this unfair fight. Carl says: Blackhawks in 5.
***********************
| Date | Team | Dec | OS | HR | Opp | GF | GA | PPG | PPOpp | PPGA | TS | SF | SA | ANA FenCl | Det FenClo |
| 2/15/2013 | ANA | W | R | DET | 5 | 2 | 0 | 3 | 1 | 4 | 37 | 28 | #N/A | #N/A | |
| 3/22/2013 | ANA | L | H | DET | 1 | 5 | 0 | 3 | 1 | 2 | 34 | 23 | 46.55 | 51.54 | |
| 3/24/2013 | ANA | L | H | DET | 1 | 2 | 1 | 3 | 1 | 6 | 34 | 21 | 46.58 | 51.52 |
2-ANAHEIM (5-4-1) vs 7-DETROIT (5-2-3)
Besides the obvious points difference (10 more for the Ducks), there are only two key areas in which these well matched opponents have had a clear edge on each other: Anaheim’s 4th ranked PP vs Detroit’s 15th and The Wings’ Jimmy Howard out-stopping Jonas Hiller (.923 to .913 SV%). Both teams possess proven warriors on their top lines, but Mike Babcock has more quality forward depth to draw upon (specifically Johan Franzen and Valtteri Filppula). Anaheim’s defense is stronger individually, but Babcock’s system seems to have taken hold lately and his forwards are better backcheckers. Carl says: Red Wings in 6.
Follow the McKeen's team on Twitter:
@KatsHockey
@mckeenshockey


